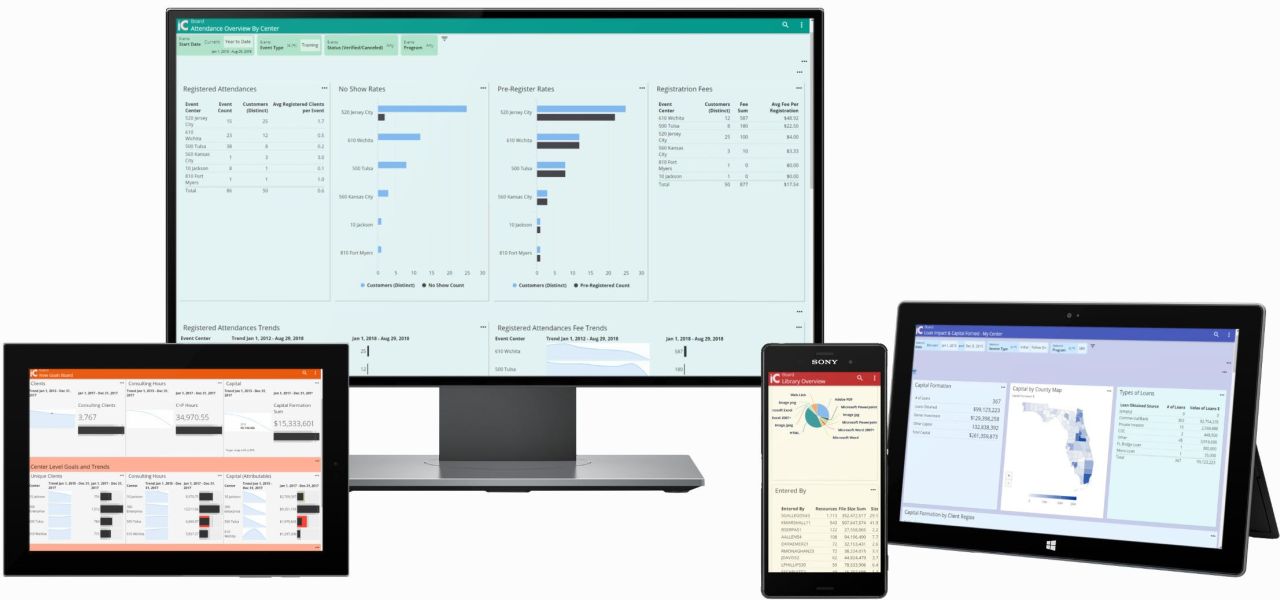

IC Boards gives you the tools necessary to construct an information display board built from flexible report tiles.
Use the sample boards we provide, or make your own.
Create dashboards, scoreboards, lists, reports, etc.
Tailor them for individuals, centers or even the whole network.
Engage the power of visual perception with information dashboards and scoreboards to clarify center business intelligence at myriad levels.
Select from 15 different chart types plus trend and map visualizations to enhance your boards.
Visual Analytics Charts
Choose from over 15 different chart types to visualize your data.
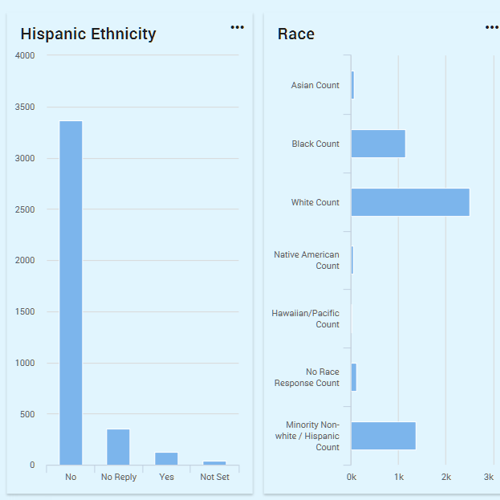
Bar and Column Charts
The most popular and useful of all chart types
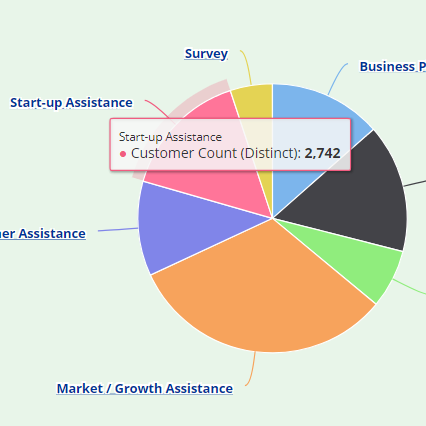
Pie Chart
Visually appealing
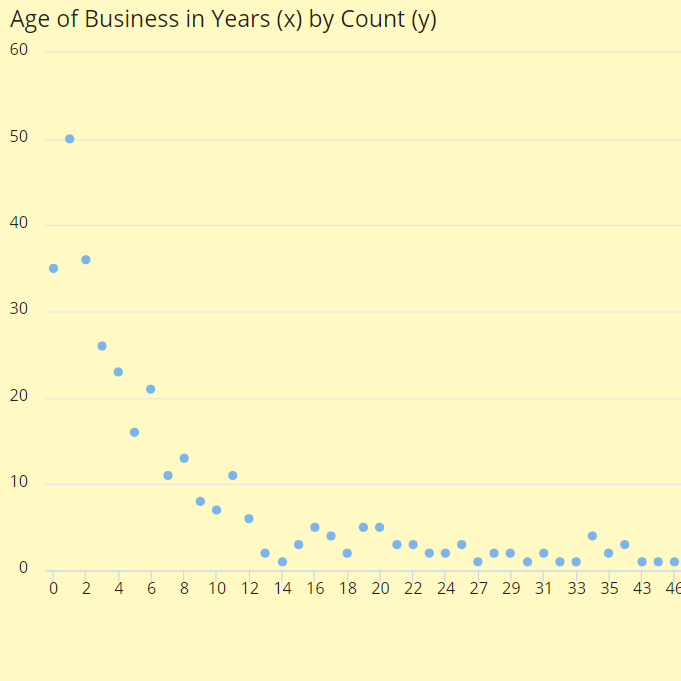
Scatter Plot
To help find hidden trends
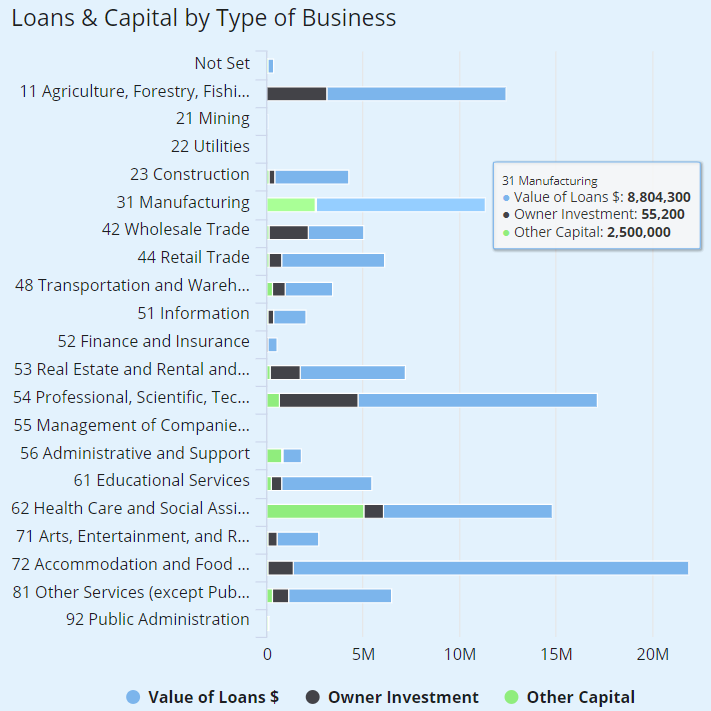
Stacked Bar
Good for comparing related data
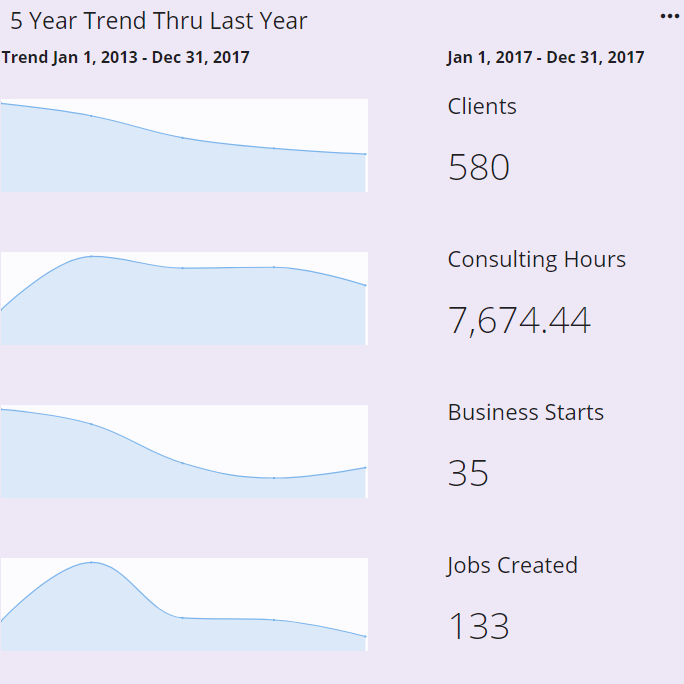
Trend Charts
Compare multiple metrics over time. Slice by days, weeks, months, quarters or years
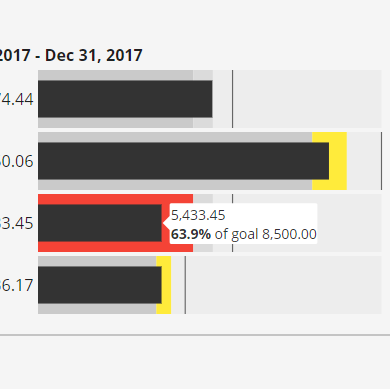
Bullet Charts
A special chart that can display goals and ranges. Point a metric to a goal, choose your tolerances, and the bullet chart shows values that do not meet goals in red, or yellow if close.
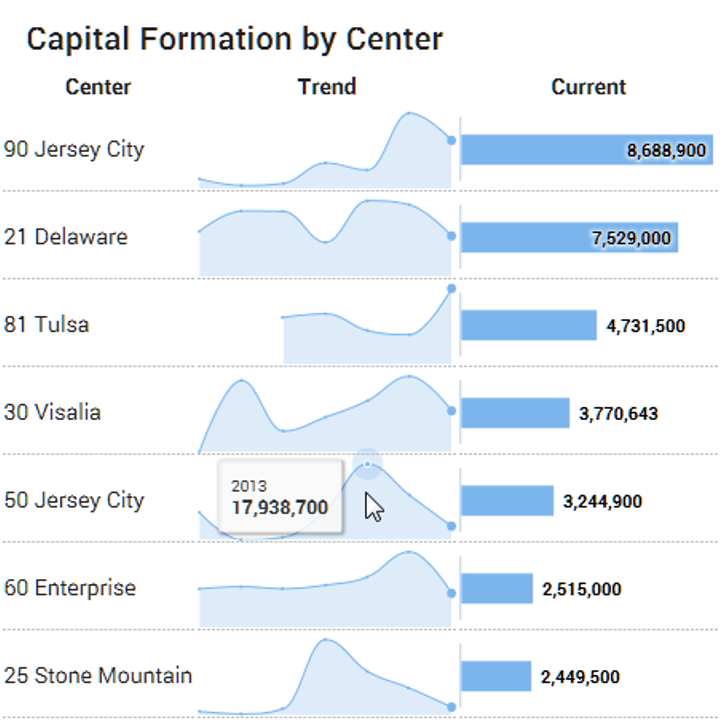
Trend Charts with Column
Compare a metric over time grouped by another data field
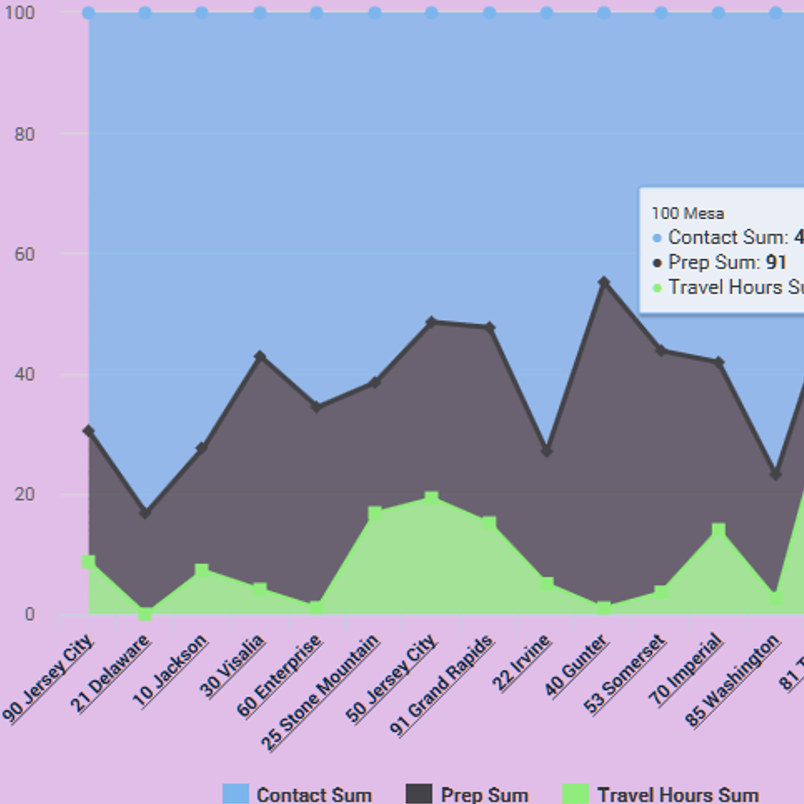
Stacked Area
For measures that can be added together
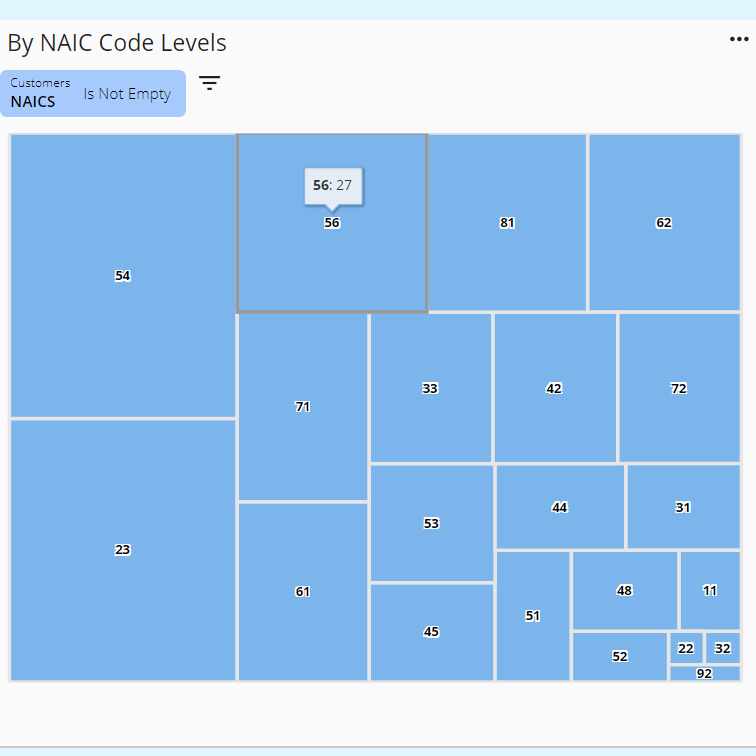
Tree Chart
Shows relative data very effectively
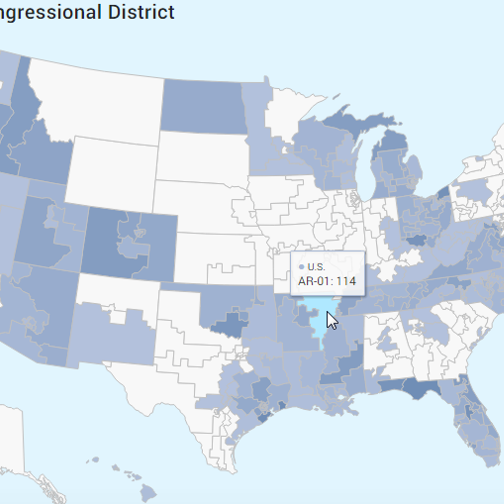
Map Visualizations
Visualize your customer data by geography. Includes US states, counties, and congressional districts. Drill into the data by clicking on the map.
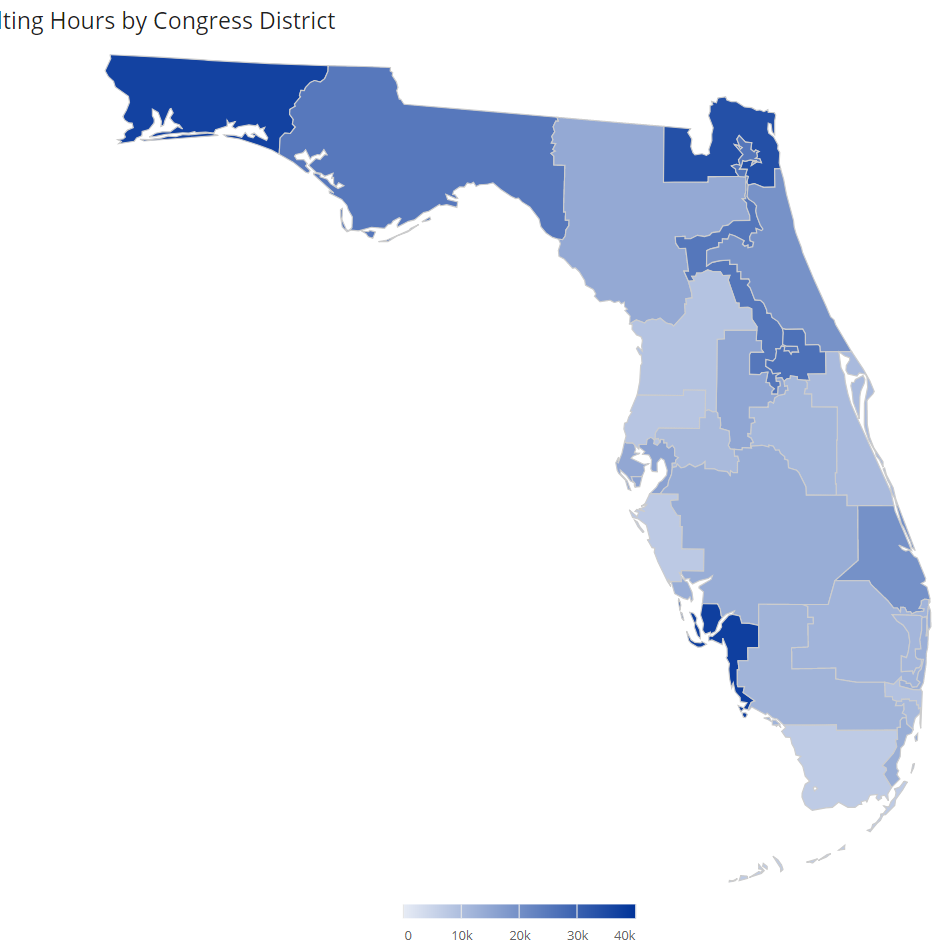
State Congressional Districts
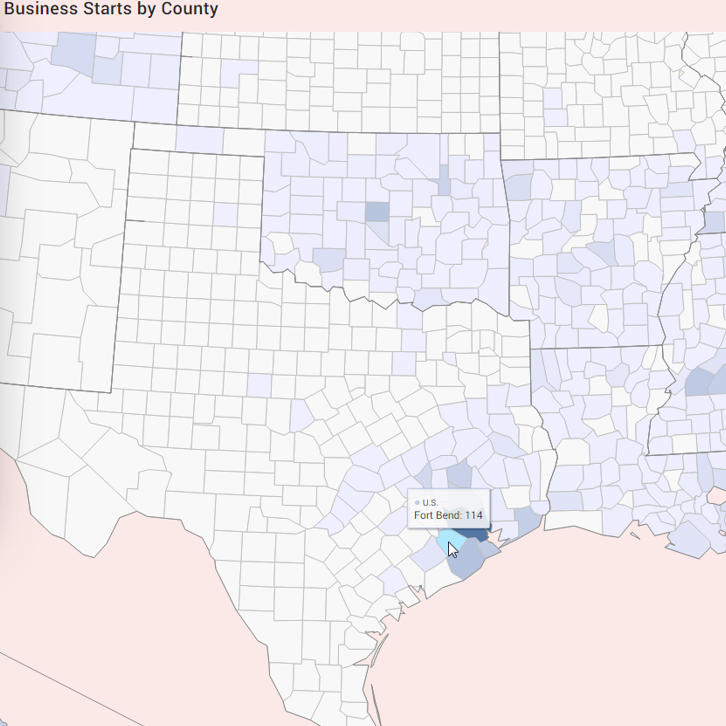
US Counties
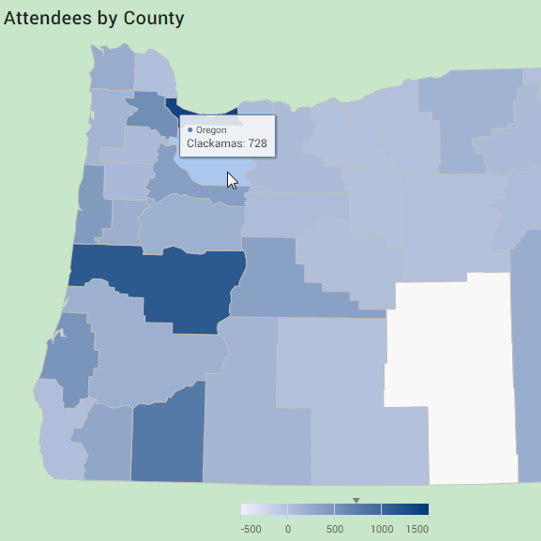
State Counties